2026 H1 Crypto Market Recap: Winners, Losers, and What to Set Up For
BTC opened 2026 at $95,000 on January 1. By the end of June the market had run a full cycle of high-range chop, pullback, and volume compression. There was no clean directional bull run, and no 2022-style systemic crash either — it looks much more like an extension of 2024’s structural rotation plus range repetition, but with sharper sector divergence than last year. This piece recaps by sector, reviews the key events, and ends with a deployment framework for H2.

BTC: high-range chop, institutional supply absorbed
BTC ran between $90K and $105K in Q1, briefly tagged $108K in April, then pulled back to the $75K zone in May. H1 max gain was about 15%, max drawdown about 22% — mild by crypto standards.
The temper of the moves comes from continuous ETF inflow penetration. RIA and pension money trades on monthly clocks, not minutes, which smooths the peaks — and also smooths the upside fireworks. There was no 2017 or 2021-style “up 40% in a week” episode.
On supply, the long-term holder share (over 1 year) ticked up slightly to around 70%, a historically firm reading. Short-term holder cost basis sits near $82K, and the May pullback briefly punched below it, triggering some forced selling.
ETH: underperforming BTC, foundation rebuilding
ETH was structurally underperforming in H1. The ETH/BTC ratio slid from 0.038 at year-start to around 0.029 — a low band since 2020. Surface story: Solana and other L1s siphoning attention. Deeper story: the market is still digesting how the Pectra upgrade and L2 expansion affect ETH’s value capture.
The fundamentals are not bearish. L2 EIP-4844 blob usage keeps rising, restaking TVL approaches the 2024 high again, and liquid staking’s share of supply keeps grinding up. ETH “use value” is deepening; “speculative premium” is compressed.
SOL: fundamentals win, price chops
SOL ran $130–$200 with about 8% net upside — unremarkable price action, but fundamentals stayed strong. Daily transaction count held above 20 million, DEX volume repeatedly topped all chains, and the meme season afterglow kept pump.fun-style venues active. “Strong fundamentals plus choppy price” historically previews a second-half catch-up — conditional on risk appetite returning.
Memecoins: from euphoria to differentiation
H1 was the “rational reset” phase for memes. January’s TRUMP, MAGA, and AI-themed tokens completed the last burst. Starting in February, single-token explosions slowed sharply and capital concentrated into a handful of “old memes” — DOGE, PEPE, WIF, BONK — which themselves diverged. The healthiest signal is whether the patterns described in identifying rug pull projects are weakening, and they were. The sector sits in low-intensity continuation mode — neither the early-2024 mania nor a full freeze.
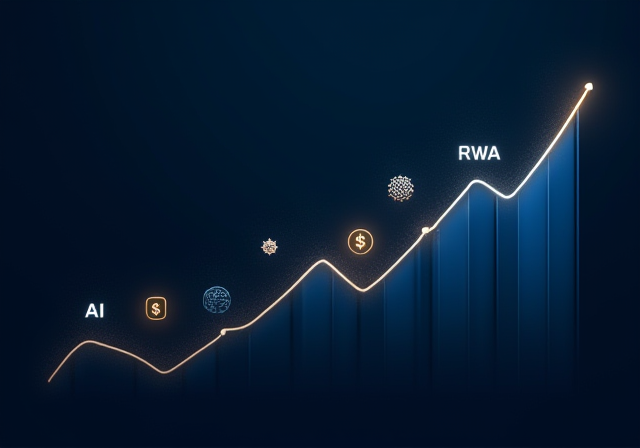
AI and RWA: two structural through-lines
AI was one of the few sectors clearly outperforming BTC. Older AI tokens like TAO, Render, and Fetch.ai posted 30%–60% gains, while onchain AI agent projects moved from narrative to shipping. The fuel is AI valuation transmission from traditional tech equities — crypto AI tokens became the high-beta wrapper for that theme.
RWA continued its quiet expansion. Tokenized treasuries crossed $20 billion in TVL, with BlackRock BUILD alone near $8 billion. No explosive moves, but the steadiest TVL curve in the market — see the AI plus RWA project map and RWA tokenization.
Key events of the half
| Time | Event | Impact |
|---|---|---|
| Feb 2026 | One-year Pectra mainnet retrospective published | Brief ETH strength, then range-bound again |
| Mar 2026 | SEC drops lawsuit against a major DeFi protocol | DeFi blue chips broadly up 20%+ for the week, including Aave-style lending |
| Apr 2026 | Mt. Gox final distribution batch completed | Distal contributor to the May downside |
| May 2026 | Nasdaq BTC index options conditionally approved | Derivatives expansion, strengthens institutional rails |
Individually small, collectively pointing in one direction: regulation, derivatives, custody, and institutional pipes keep improving — see also the US SEC stance overview.
Retail and institutions diverged
The most notable H1 development is the clear reversal of positioning between retail and institutions.
CEX spot volume fell 18% year-on-year, retail activity dropped, search and social mention volumes sit at lows since early 2024. Meanwhile BTC dominance held in a 56%–60% range and altcoin season failed to launch.
Institutions did the opposite: ETF inflows stayed net positive, CME open interest hit record highs, futures funding stayed muted leaving arbitrage spreads available. Historically the “retail cold, institutions hot” combination appears in late-cycle consolidation phases, not bear-market starts. The support structure thickens; only the spark is missing — pair this with the 2026 crypto trends overview for the H2 rhythm.
Deployment framework for H2
| Window | Watch | Posture |
|---|---|---|
| Jul–Aug | Fed cadence, ETF flow reacceleration | Hold neutral, wait for trend confirmation |
| Sep–Oct | Statistical window of halving cycle month 18 | Historically a direction-choosing point |
| Nov–Dec | Policy execution after the US election | Watch stablecoin and DeFi legislation |
Layer technicals on top — RSI and MACD usage alongside the trading intro pair well.
H1 recaps, H2 deploys
H1 brought no “big move,” but it brought meaningful structural sedimentation: ETF flows kept penetrating, institutional rails matured, ETH and L2 completed a valuation redistribution, AI and RWA established themselves as dual through-lines. That sedimentation matters in itself — it means once H2 sparks, the elasticity will be larger than expected.
H1 recaps, H2 deploys.