Should Crypto Traders Keep a Journal? A 2026 Template That Can Cut Your Drawdown by 20%
Almost nobody in crypto wants to keep a trading journal. The reason is simple — logging a trade takes ten minutes, clicking a buy takes three seconds. Anyone with two years in markets quietly knows one thing: without a journal, there is no real review process. Memory is unreliable — the brain auto-glamorizes winners and blurs losers, letting you repeat the same mistake for years without noticing. This piece is not just a template. It explains the underlying mechanism so you can see why three months of discipline naturally lifts your win rate.

Why most journals are useless
I have met plenty of people who genuinely write entries yet get nothing out of them. The reason is the same — they turned the journal into a ledger: what they bought at what time, what they sold at what price, how much they made. That information already exists in the exchange’s history, copying it adds zero value.
A useful journal answers why, not what. Every trade should answer four questions:
- Why did I enter this trade? Which rule did it match?
- What was my emotional state at entry — calm, anxious, FOMO?
- Did execution drift from the plan? Why?
- Profit or loss is secondary — did this trade align with my strategy?
Answering those four upgrades the journal from a ledger into a decision audit. A losing trade can be correct, a winning trade can be wrong. The only way to tell which is which is to commit the reason to writing before the outcome.
A template you can use immediately
This is the version I stabilized after years of iteration. One row per trade:
| Field | Meaning | Example |
|---|---|---|
| Time | Entry timestamp | 2026-05-30 14:23 |
| Symbol | Pair | BTCUSDT |
| Side | Long/short | Long |
| Entry | Average fill price | 70150 |
| Size | Notional in USD | 5000 USDT |
| Leverage | Effective multiplier | 3x |
| Signal | Trigger reason | RSI oversold + 4h support |
| Plan SL | Planned stop loss | 69300 |
| Plan TP | Planned take profit | 71800 |
| Emotion 1-5 | Intensity at entry | 2 (calm-ish) |
| Drift | Execution deviation | None / early exit / unplanned add |
| Result | PnL % | +1.8% |
| Review tag | Self-classification | Planned win / planned loss / unplanned win / unplanned loss |
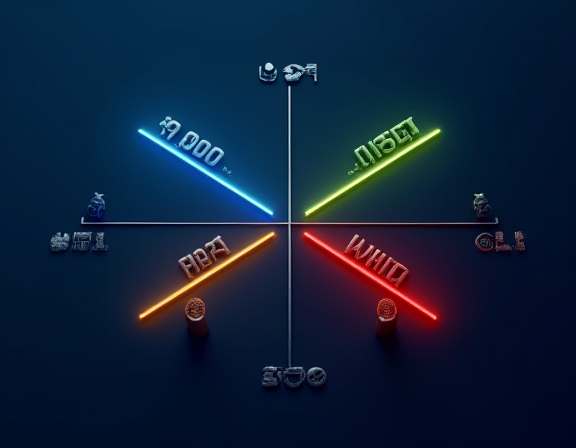
The decisive column is the last one — “review tag”. It sorts each trade into a four-quadrant grid. “Planned win” and “planned loss” are good trades, your strategy is running by rules. “Unplanned win” and “unplanned loss” are both bad trades — the win was lucky, the loss was out-of-control. Most traders track PnL. Real growth comes from tracking plan compliance.
Why the emotion column is non-negotiable
Many templates omit emotion. I keep including it because most losing trades correlate with a specific emotional state. Aggregate weeks of journal data by emotion and patterns emerge:
- Trades entered at emotion 4-5 (anxious / FOMO) win less than baseline
- Trades entered at emotion 3 (neutral) win the most
- Trades entered at emotion 1-2 (overconfident / numb) often carry oversized positions
These curves are not universal — everyone’s emotion-vs-winrate map is different — and only a journal can surface yours. Once you know it, the rule writes itself: when emotion enters the “high loss zone”, force-cut size or pause trading. Holding that rule reliably collapses overall drawdown.
If your position sizing fundamentals are still shaky, start with the leverage and psychology section in the liquidation prevention guide.
Review cadence: daily, weekly, monthly
Writing the journal is step one. What actually changes behavior is structured review. Three layers of cadence:
- Daily (5 min): end of day, walk through every trade, tag plan compliance, log emotion. No trend analysis here, just fact archiving.
- Weekly (30 min): weekend, aggregate the week by review tag, compute planned vs unplanned win rate and PnL. Pay special attention to “unplanned wins” — they were luck, and you must refuse them next time the same setup appears.
- Monthly (2 hr): month-end, export everything, slice by four dimensions — symbol, signal source, emotion, time-of-day. This layer reveals which scenarios your strategy actually works in, and which secretly cost money.
Many traders only do daily — pure data collection, no synthesis. Monthly review is where the strategy actually changes — you might find a beloved signal source carries negative Sharpe over three months and must be dropped.
Use the journal to uncover “fake win rate”
Beginners commonly fall into the trap of estimating win rate from fragmented memory. “I feel my shorts win more than longs”, “I feel intraday makes more than swing” — most of those intuitions are wrong.
Journal data supports rigorous slicing. Three months of trades, cut by:
- Long vs short (direction)
- Range-bound vs breakout (signal type)
- Intraday (< 1 day) vs swing (1-7 days) vs position (> 7 days)
- Asian session vs US session vs late-night
Surprises are common — many traders find their short win rate clearly lags long win rate, often because shorts trigger more anxiety and looser stops. Exposing that structural weakness clears the path for adjustment. Direction calibration loops back into the RSI + MACD technical analysis primer.
Tool choice: Notion, Excel or a dedicated app
The tool does not matter, persistence does. Common picks:
- Excel / Google Sheets: classic, flexible, easiest to aggregate
- Notion: friendly for rich text and chart embeds, paste screenshots
- Dedicated apps like Edgewonk or TraderSync, auto-import from exchange, saves manual entry
- DIY Python + database: the engineering route, deeper statistics
After cycling through several I came back to plain Excel. Frequency and honesty drive outcomes, not tool sophistication.
What changes after three months
If you fill the journal daily, aggregate weekly and review monthly, three months in you typically notice:
- A three-second pause before every entry — knowing this will be logged forces more rigor
- Active size-cuts or trading pauses during emotional extremes — the curve already showed you what 4-5 emotion does
- Plan compliance climbing month over month — hard evidence of behavior change
- Overall drawdown drops materially, even without a higher win rate, because bad trades get smaller
That is why I put “cut drawdown by 20%” in the title — the journal does not make winning trades bigger, it makes losing trades smaller. Shrinking bad trades compounds more value over years than chasing a perfect strategy. To embed this habit inside a broader framework, work through the trading guide for the system-level perspective.