Has Bitcoin Bottomed Yet? Real Cycle-Bottom Signals to Watch in 2026
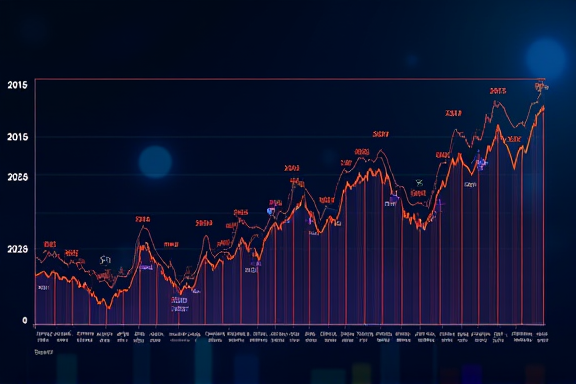
BTC dropped from the October 2025 peak of 110K to 71K in April 2026, rebounding to 75K by end of May — a seven-month, 35% drawdown. Twitter sentiment rotated from “BTC to 200K” euphoria last year, to “another 50% down” panic in March, to “dead-cat bounce” uncertainty now. Calling a bottom isn’t guessing — it’s checking whether on-chain indicators have hit historically bottom-grade readings simultaneously. The last three bear markets (2015, 2018, 2022) left clean indicator signatures. This piece pulls May 2026 readings on MVRV, SOPR, LTH positioning, miner pressure, and stablecoin market cap, compares to past bottoms, asks how close we are.
MVRV-Z Score: the first chart to read
MVRV (Market Value to Realized Value) is the baseline indicator — market cap over realized value (the cost basis of each BTC’s last on-chain transfer). MVRV-Z normalizes it. The last three bear bottoms corresponded to MVRV-Z dropping below zero:
| Date | BTC price | MVRV-Z Score | Notes |
|---|---|---|---|
| Jan 2015 | 178 | -0.4 | First bear bottom |
| Dec 2018 | 3,200 | -0.3 | Second bear bottom |
| Nov 2022 | 15,500 | -0.2 | Third bear bottom |
| May 2026 | 75,000 | +0.8 | Current |
Today’s +0.8 is well above any historical bottom. Even with sentiment souring, holders’ cost basis hasn’t been broken. Extrapolating, the actual bottom corresponds to BTC near 55K-60K based on current realized value. MVRV-Z may need recalibration in the “institutional asset” era — ETF cost basis differs from retail, the traditional reading may run higher without implying a higher bottom. So MVRV alone isn’t enough. Halving-cycle logic at Bitcoin halving cycle.
SOPR: where the selling is actually coming from
SOPR (Spent Output Profit Ratio) measures whether each on-chain transfer is in profit or loss — above 1 means sellers profitable on average, below 1 means underwater. Bottom signal: SOPR holding below 1 for 4-6 weeks — loss-driven capitulation.
May 2026: SOPR fell below 1 early April, recovered within a week; broke again mid-April, recovered to 1.005 by early May; end of May oscillates near 1.01. No sustained capitulation yet — historical bottoms held 0.95-0.98 for 6-8 weeks. Current selling is “small-loss stops + profit-taking,” typical mid-cycle correction, not terminal-bottom behaviour.
Long-term holders: are they accumulating or distributing?
LTH (holders for 155+ days) is one of the most reliable cycle indicators — distributing at tops, accumulating at bottoms. May 2026: total LTH supply 14.3M BTC (72% of circulating), 90-day net change +380K, 30-day +120K. Strong bullish signal — LTH absorbed 380K over 90 days, a meaningful share of daily sellers. LTH share rising from 65% (top) to 75% historically marks the bottom — 72% today is close to the line.
Stacked with MVRV: MVRV says “not extreme cheap,” LTH says “heavy accumulation.” The contradiction means non-LTH is selling at a loss while LTH absorbs at lower prices. This redistribution typically occurs 3-6 months before the bottom prints — the precursor. On-chain method basics at Bitcoin guide.
Miner pressure: capitulation or holding steady?
Miners are BTC’s permanent sellers — daily issuance covers operations. Two stress indicators: Puell Multiple (miner daily revenue vs 365-day average, historical bottoms < 0.5, May 2026 = 0.62) and Miner Reserve (1.87M peak October 2025, 1.75M May 2026, down 120K).
120K drawdown over seven months is 6.4% of peak — meaningful but not catastrophic. No panic mode. Puell 0.62 is depressed but not the historical “collective capitulation” sub-0.5.
Why pressure isn’t extreme: post-halving efficiency upgrades cut unit costs — at 75K, S21 Pro miners run 30-40% gross margins, not forced to dump. Key 2026-vs-2018 distinction — 2018 miners at 3K were shutting off and selling, May 2026 isn’t there. Background at mining guide.
Stablecoin market cap: how much dry powder is on the sidelines?

Stablecoin market cap reflects “money ready to deploy” — USDT, USDC, DAI supply tells us parked purchasing power. Bottom signal: stablecoin market cap rising while BTC falls — capital rotating from risk to cash.
2026 path: October 2025 (BTC peak) 182B, February 2026 198B (+8.8%), May 2026 212B (+16.5%).
Stablecoin market cap added 30B over seven months — a strong bottom signal. Capital didn’t leave crypto; it rotated to stablecoins waiting for BTC to look cheap. Sideline capital is rally fuel. But rising market cap doesn’t tell us when the bottom prints — only that ammunition exists. Stacked with LTH, the 2026 picture is “LTH accumulating + stablecoins building + MVRV/SOPR not extreme” — structure improving, final flush not done.
Combined read: where we are in the cycle
Putting the five indicator stacks together:
| Indicator | Current | Historical bottom | Signal |
|---|---|---|---|
| MVRV-Z Score | +0.8 | < 0 | Cheap-ish, not extreme |
| SOPR | 1.01 | < 0.98 (6 weeks) | No capitulation |
| LTH net change | 90d +380K BTC | Steady accumulation | Strong bullish |
| Puell Multiple | 0.62 | < 0.5 | Mild miner stress |
| Stablecoin mcap | 212B (+16.5%) | Rising | Strong bullish |
Three of five lean bullish (LTH, stablecoin, mild miner stress), two haven’t reached extreme cheapness (MVRV, SOPR). Textbook “approaching the bottom but not finished”. Closest historical parallels: November 2018 (one month before bottom, BTC at 6K, eventual low 3.2K) and September 2022 (two months before bottom, BTC at 20K, eventual low 15.5K). Extrapolating, BTC may face one more leg down to 60K-65K to push MVRV-Z and SOPR to extremes — but the final flush isn’t guaranteed; structural indicators may be strong enough to bottom from here directly.
Three scenarios and playbooks
A: textbook bottom (50%) — BTC drops 60K-65K in 1-3 months, MVRV-Z near zero, June-July bottom. Strategy: keep 30% dry for the next leg.
B: gradual basing (30%) — BTC 70K-78K oscillation for 3-4 months, Q4 slow uptrend. Strategy: 50% via DCA, 50% added on break above 80K.
C: V-shaped reversal (20%) — BTC rallies from here, Q3 breaks 90K, year-end 110K. Strategy: increase exposure now.
A + B = 80% — most likely we need a few more months and possibly a retest, bottom confirmation no earlier than Q3 2026. But C isn’t unreasonable — ETF flows, institutional inertia, rate-cut expectations may break the “must flush 50%” template.
Two fundamental differences from prior cycles
Difference one: ETF stickiness — BTC spot ETF holdings grew from zero to 950K BTC. ETF holders are institutions and retirement accounts — far steadier than retail. Even with BTC down 35%, net outflows are 12% of holdings (retail in 2018 dumped 60%). That sticky inventory dampens capitulation peaks; traditional “extreme cheap” readings may simply not occur as deeply. See Bitcoin spot ETF.
Difference two: post-halving miner cost structure — 2024 efficiency upgrades raised the bar for capitulation.
Together, 2026’s bottom may be shallower but slower to confirm — “moderate decline + slow basing + slow grind higher.” Longer argument at is the Bitcoin cycle changing.
Practical actions
Five concrete moves:
- Not the time to fully bottom-tick — indicators near-bottom but not extreme
- Not the time to sit fully in cash — LTH and stablecoin signals say structure improving
- Sizing: 50-60% deployed, 30-40% dry in cash or stablecoins
- Add-on cadence: add 10% under 70K, another at 65K, 60K, fully loaded under 55K
- Don’t chase — if BTC rips through 80K, miss it rather than buy strength
“Neither extreme” — not betting the bottom is in, not betting we go to 50K. The cost is foregone maximum return; the upside is liquidity and participation across all three scenarios. With Bitcoin, surviving beats winning the most.